
The real estate frenzy spurred by the coronavirus pandemic continues, though at a slower pace. Buyers are still competing for a limited supply of housing, driving up prices for affordable properties.
The typical home value in the United States was $356,776 in January, 2.6% higher than the year before.
Increasing mortgage rates have slowed growth, with prices even declining in some places. But some areas are still seeing price jumps compared to the year before.
Stacker compiled a list of cities with the most expensive homes in the New York-Newark-Jersey City, NY-NJ-PA metro area using data from Zillow. Charts show the monthly typical home value since January 2018.
You may also like: How gas prices have changed in New York City in the last week
Stacker
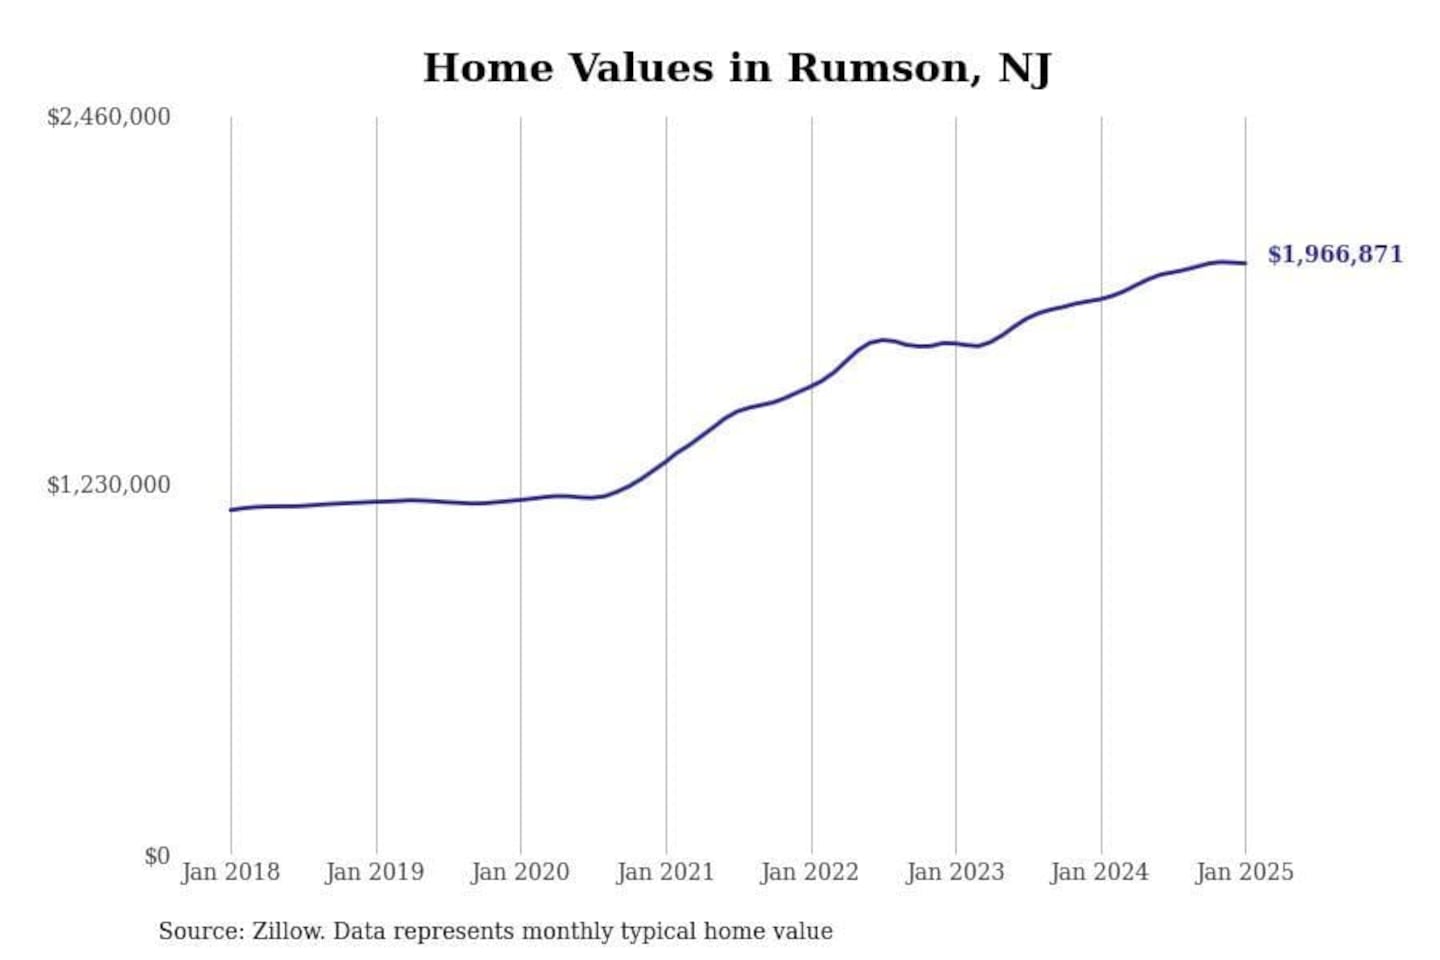
#30. Rumson, NJ
- 1-year price change: +$119,591 (+6.5%)
- 5-year price change: +$787,512 (+66.8%)
- Typical home value: $1,966,871 (#26 most expensive city in metro)
Stacker
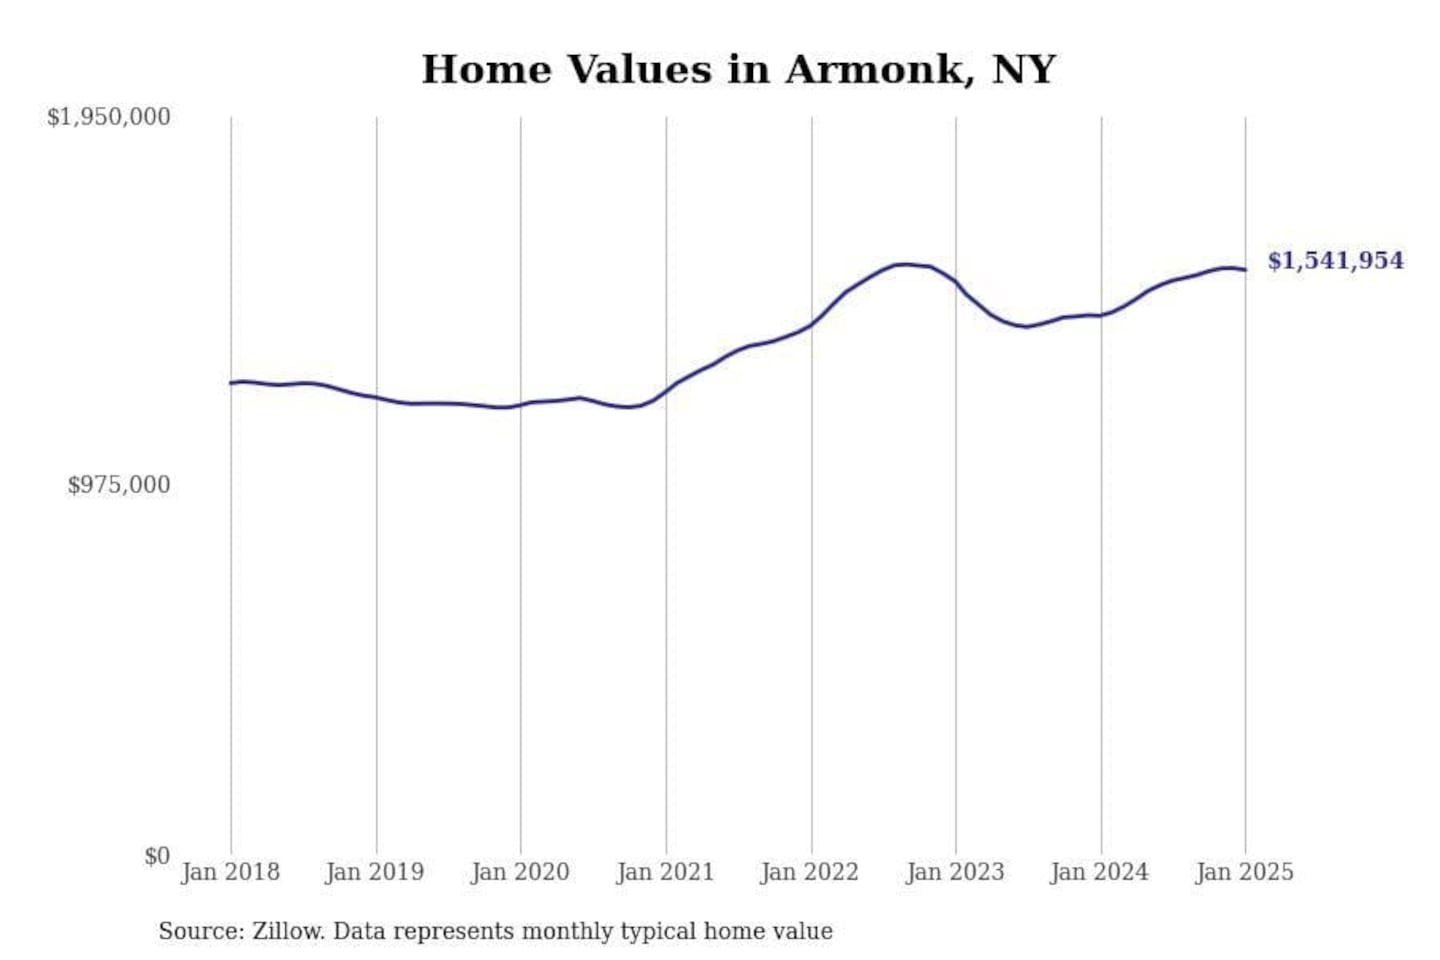
#29. Armonk, NY
- 1-year price change: +$121,045 (+8.5%)
- 5-year price change: +$357,115 (+30.1%)
- Typical home value: $1,541,954 (#41 most expensive city in metro)
Stacker
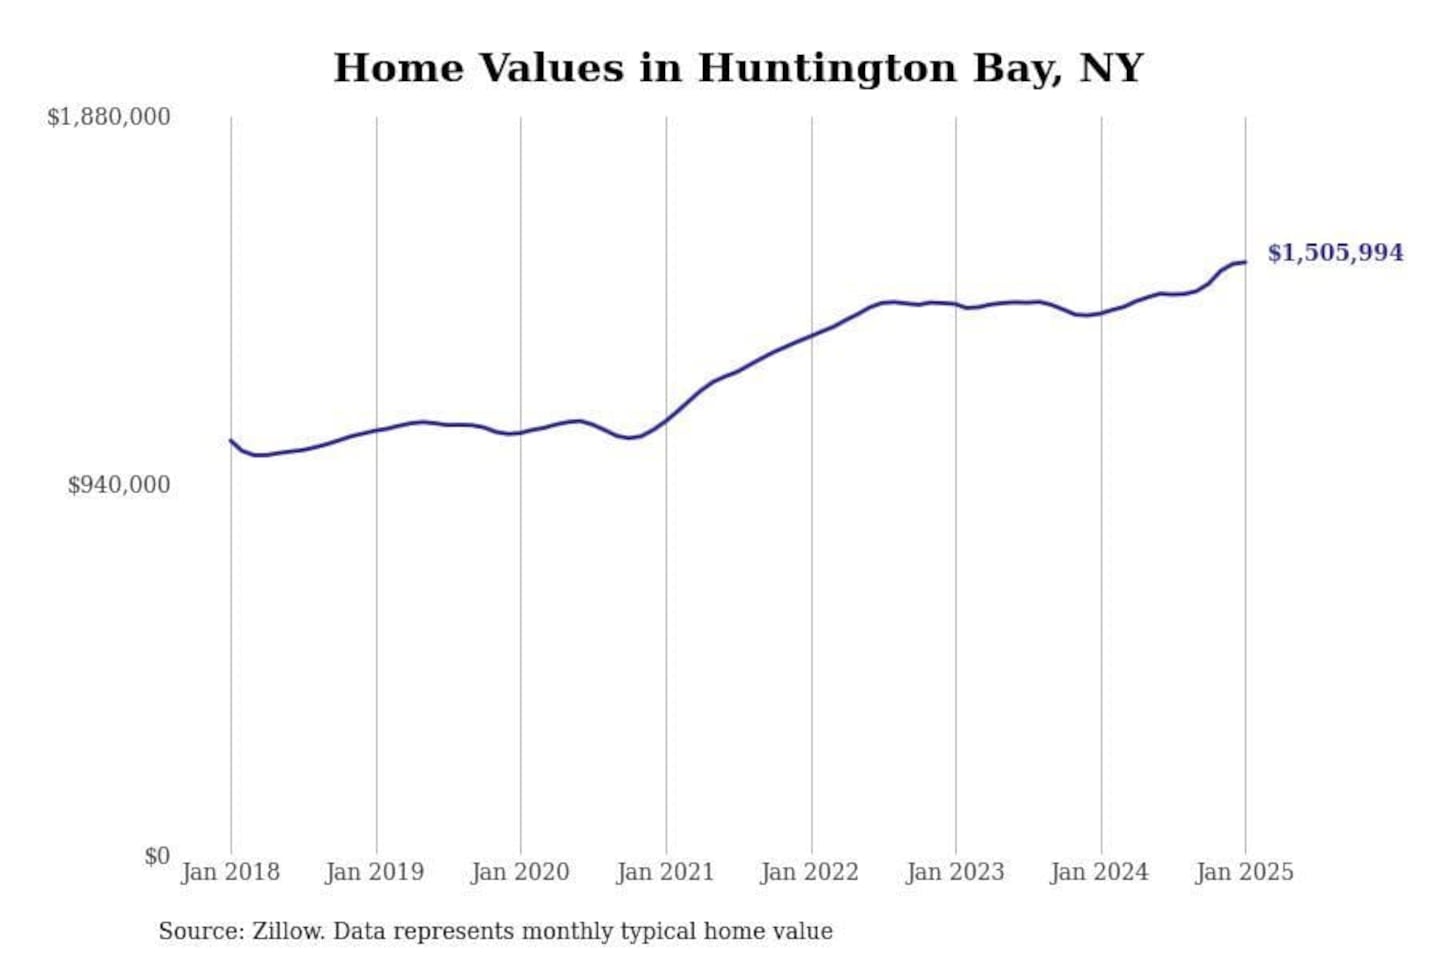
#28. Huntington Bay, NY
- 1-year price change: +$130,793 (+9.5%)
- 5-year price change: +$434,447 (+40.5%)
- Typical home value: $1,505,994 (#43 most expensive city in metro)
Stacker
#27. East Hills, NY
- 1-year price change: +$136,468 (+9.2%)
- 5-year price change: +$528,149 (+48.2%)
- Typical home value: $1,623,651 (#36 most expensive city in metro)
Stacker
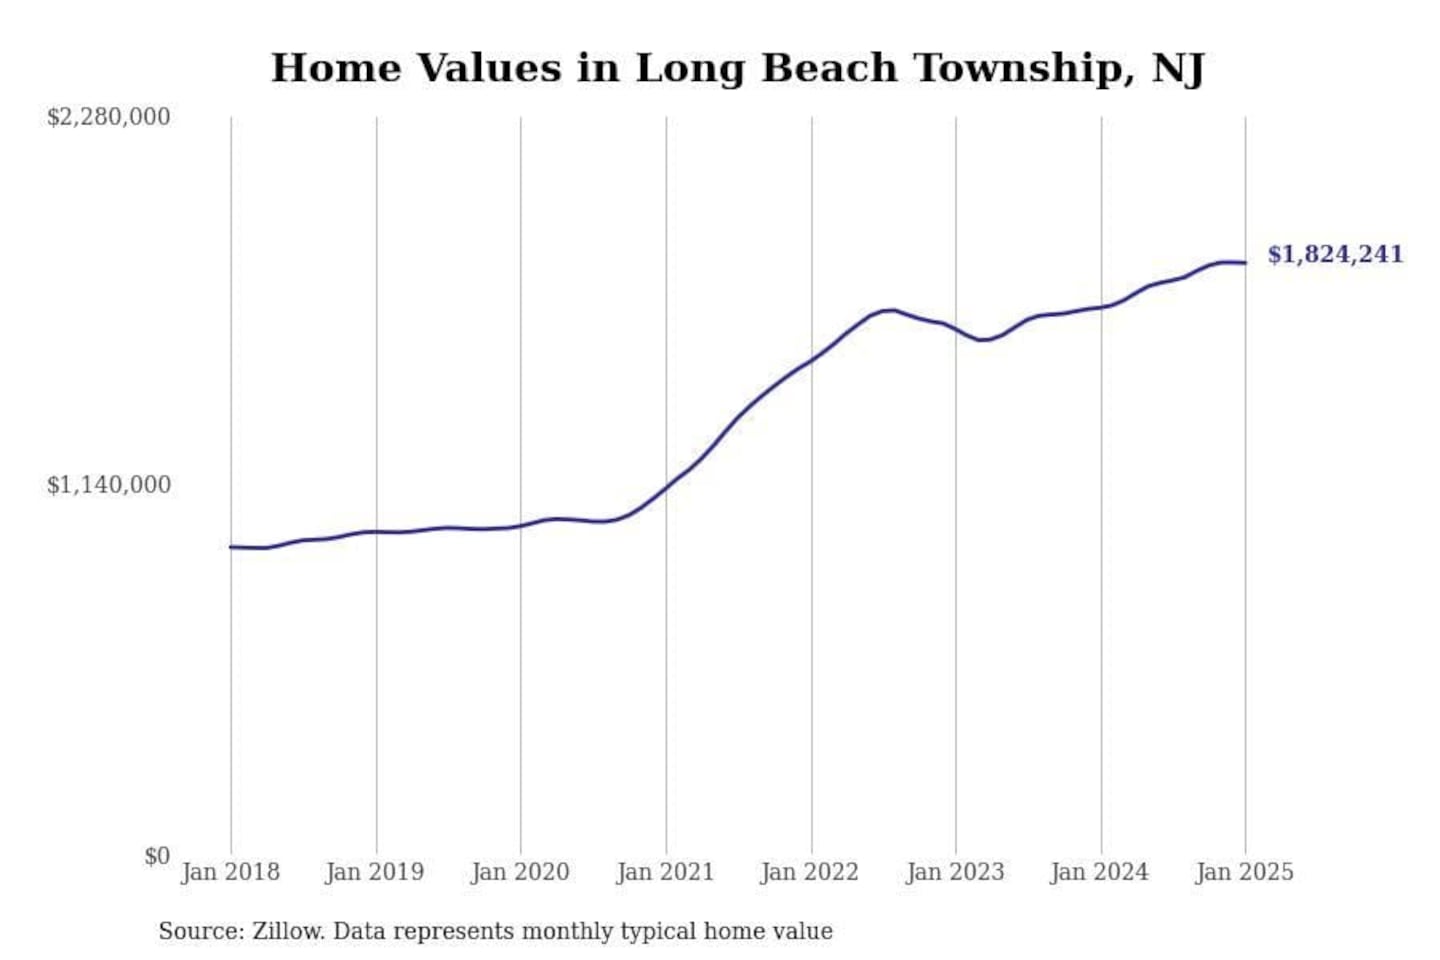
#26. Long Beach Township, NJ
- 1-year price change: +$138,181 (+8.2%)
- 5-year price change: +$811,852 (+80.2%)
- Typical home value: $1,824,241 (#33 most expensive city in metro)
You may also like: Highest-rated things to do in New York City, according to Tripadvisor
Stacker
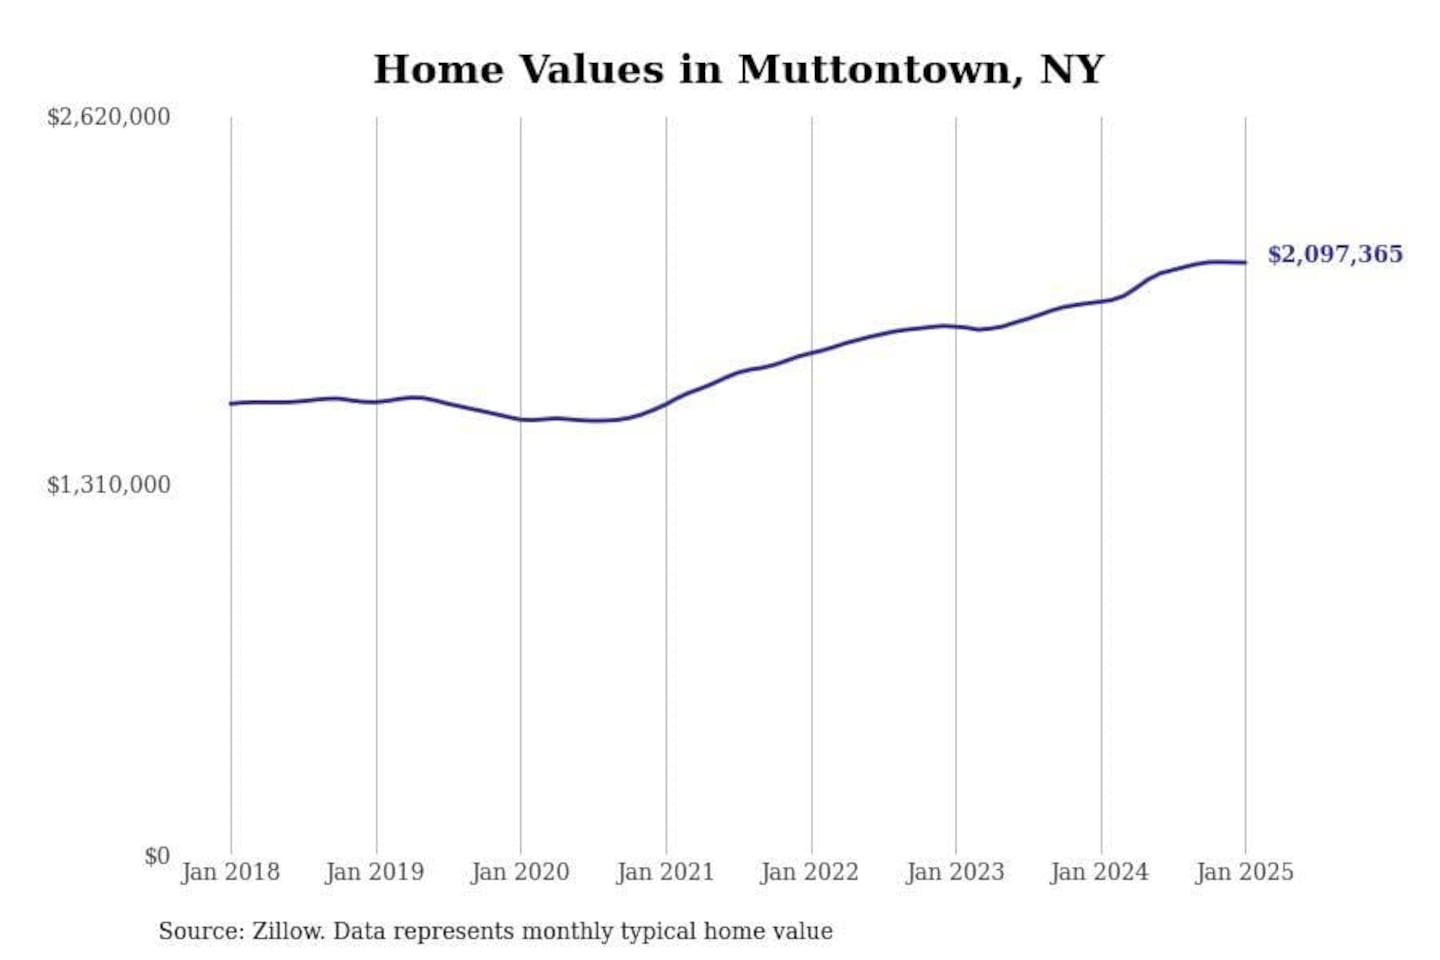
#25. Muttontown, NY
- 1-year price change: +$138,673 (+7.1%)
- 5-year price change: +$556,368 (+36.1%)
- Typical home value: $2,097,365 (#16 most expensive city in metro)
Stacker
#24. Bay Head, NJ
- 1-year price change: +$146,813 (+7.5%)
- 5-year price change: +$796,907 (+60.8%)
- Typical home value: $2,108,522 (#14 most expensive city in metro)
Stacker
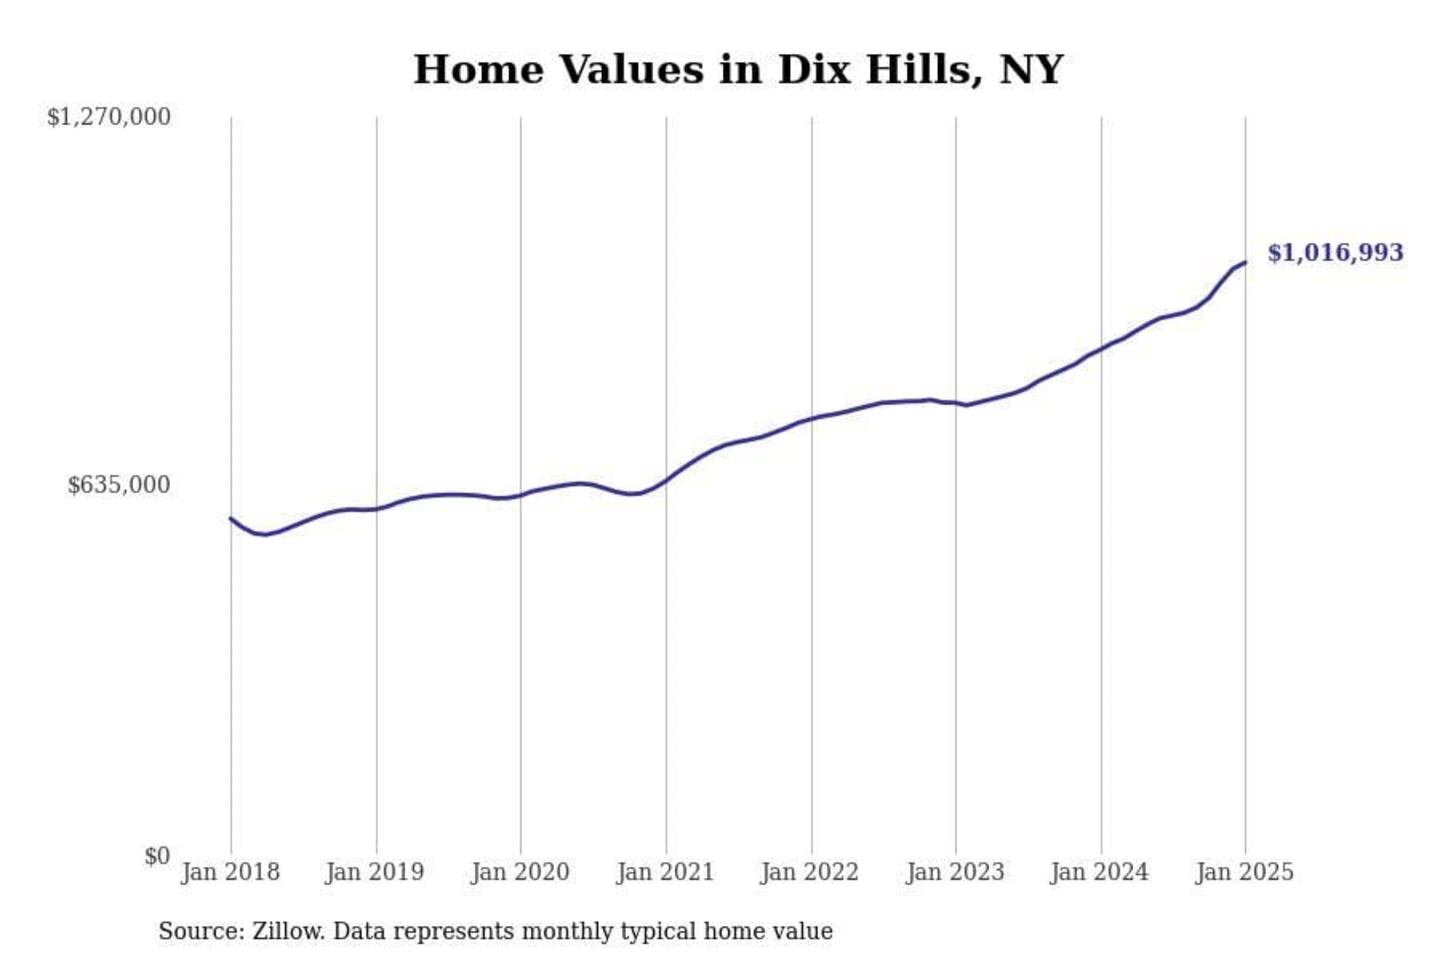
#23. Dix Hills, NY
- 1-year price change: +$150,135 (+17.3%)
- 5-year price change: +$400,764 (+65.0%)
- Typical home value: $1,016,993 (#114 most expensive city in metro)
Stacker
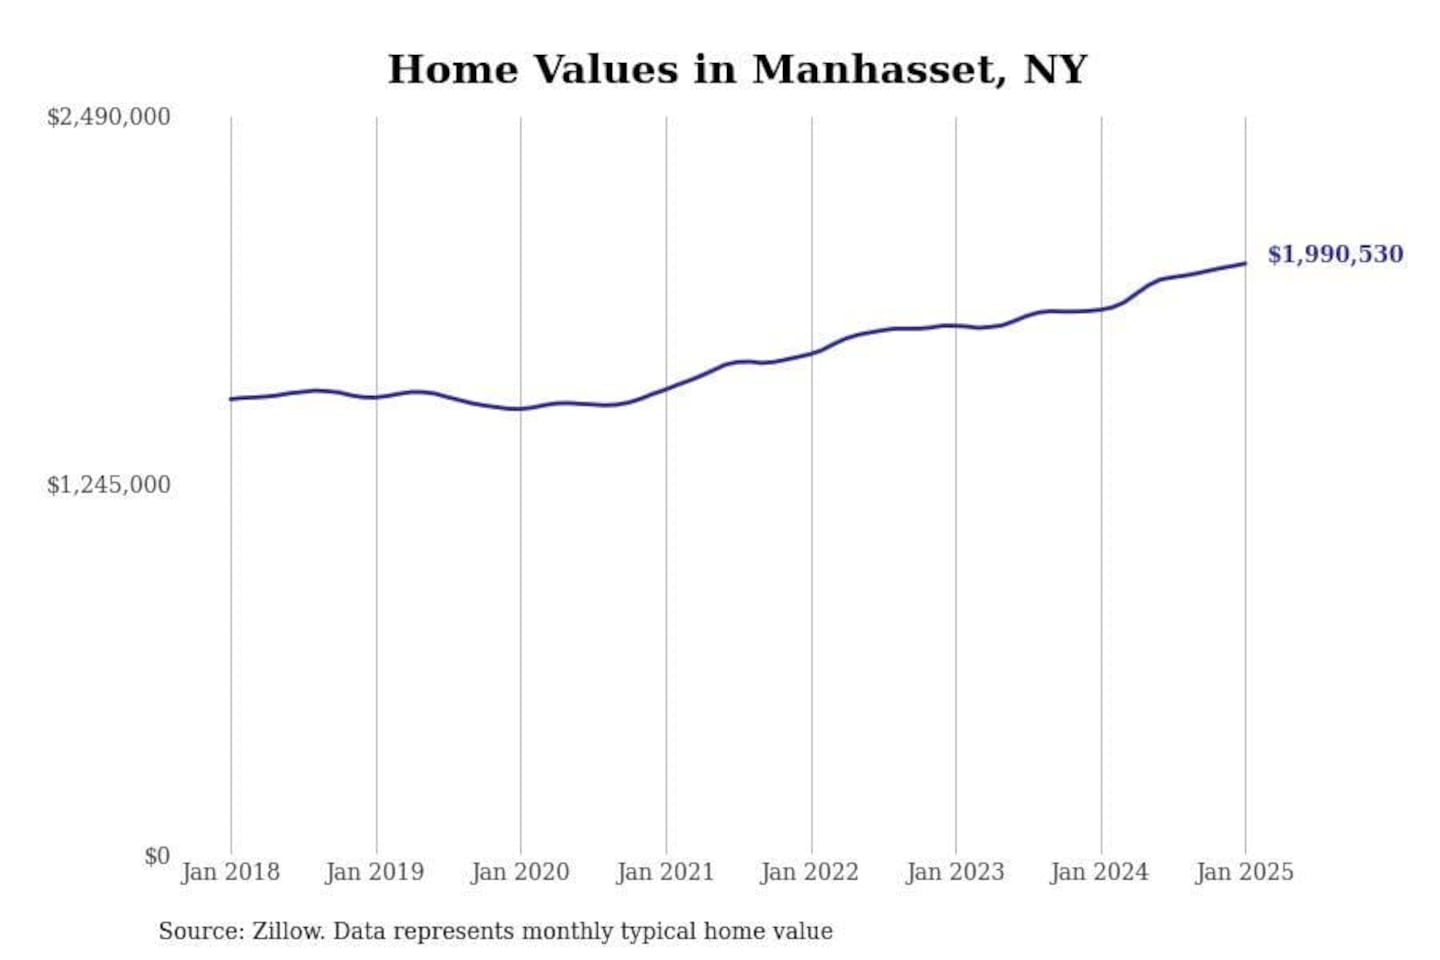
#22. Manhasset, NY
- 1-year price change: +$156,302 (+8.5%)
- 5-year price change: +$490,418 (+32.7%)
- Typical home value: $1,990,530 (#25 most expensive city in metro)
Stacker
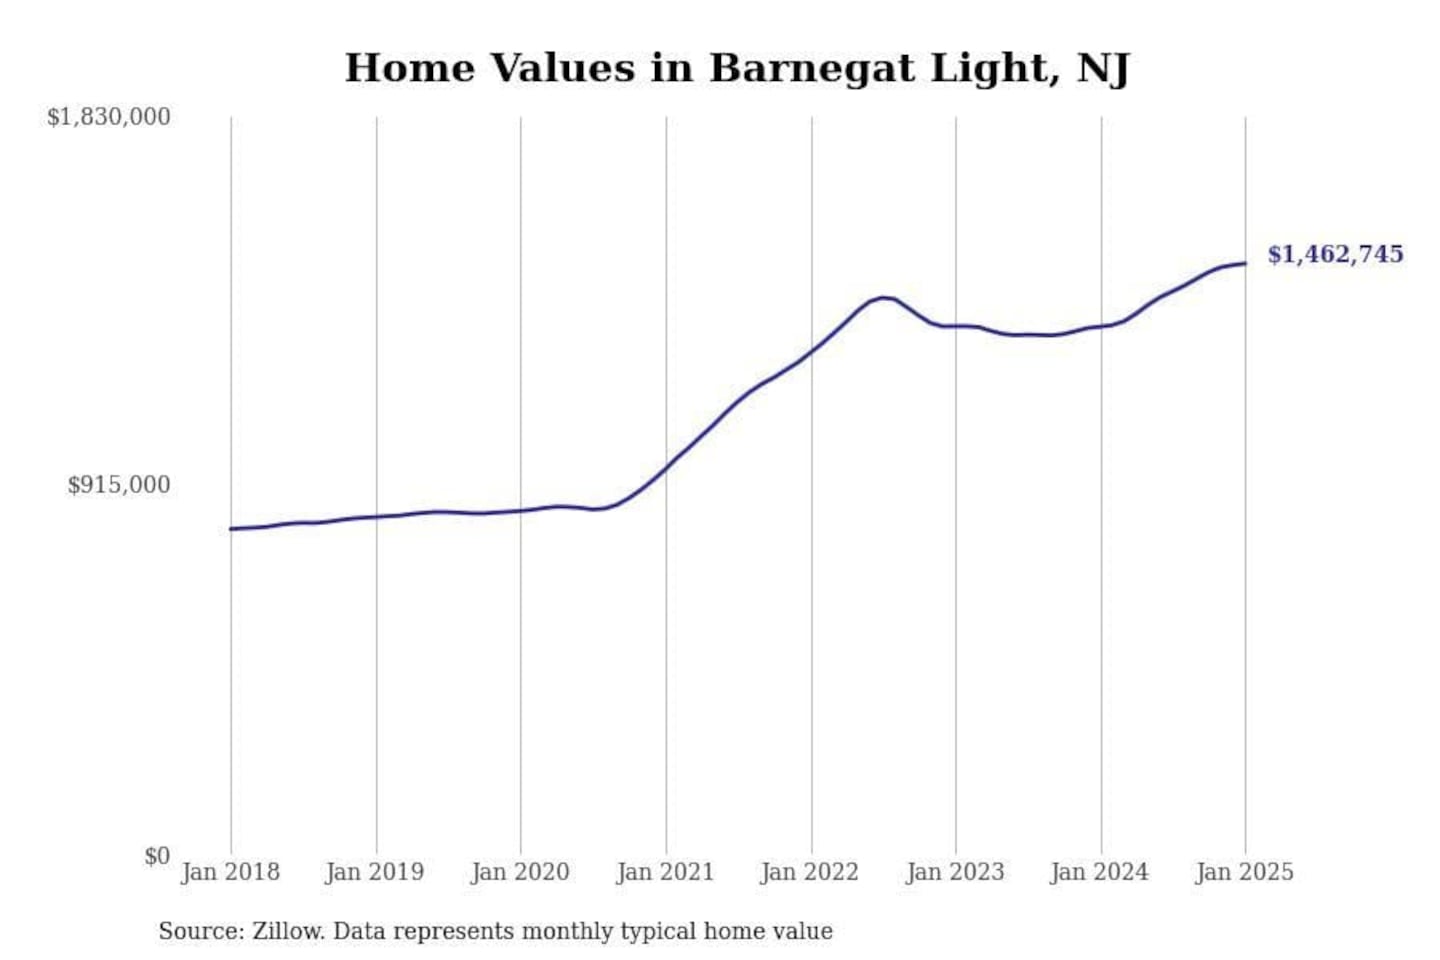
#21. Barnegat Light, NJ
- 1-year price change: +$156,342 (+12.0%)
- 5-year price change: +$612,504 (+72.0%)
- Typical home value: $1,462,745 (#46 most expensive city in metro)
You may also like: Highest-rated delis in New York City by diners
Stacker
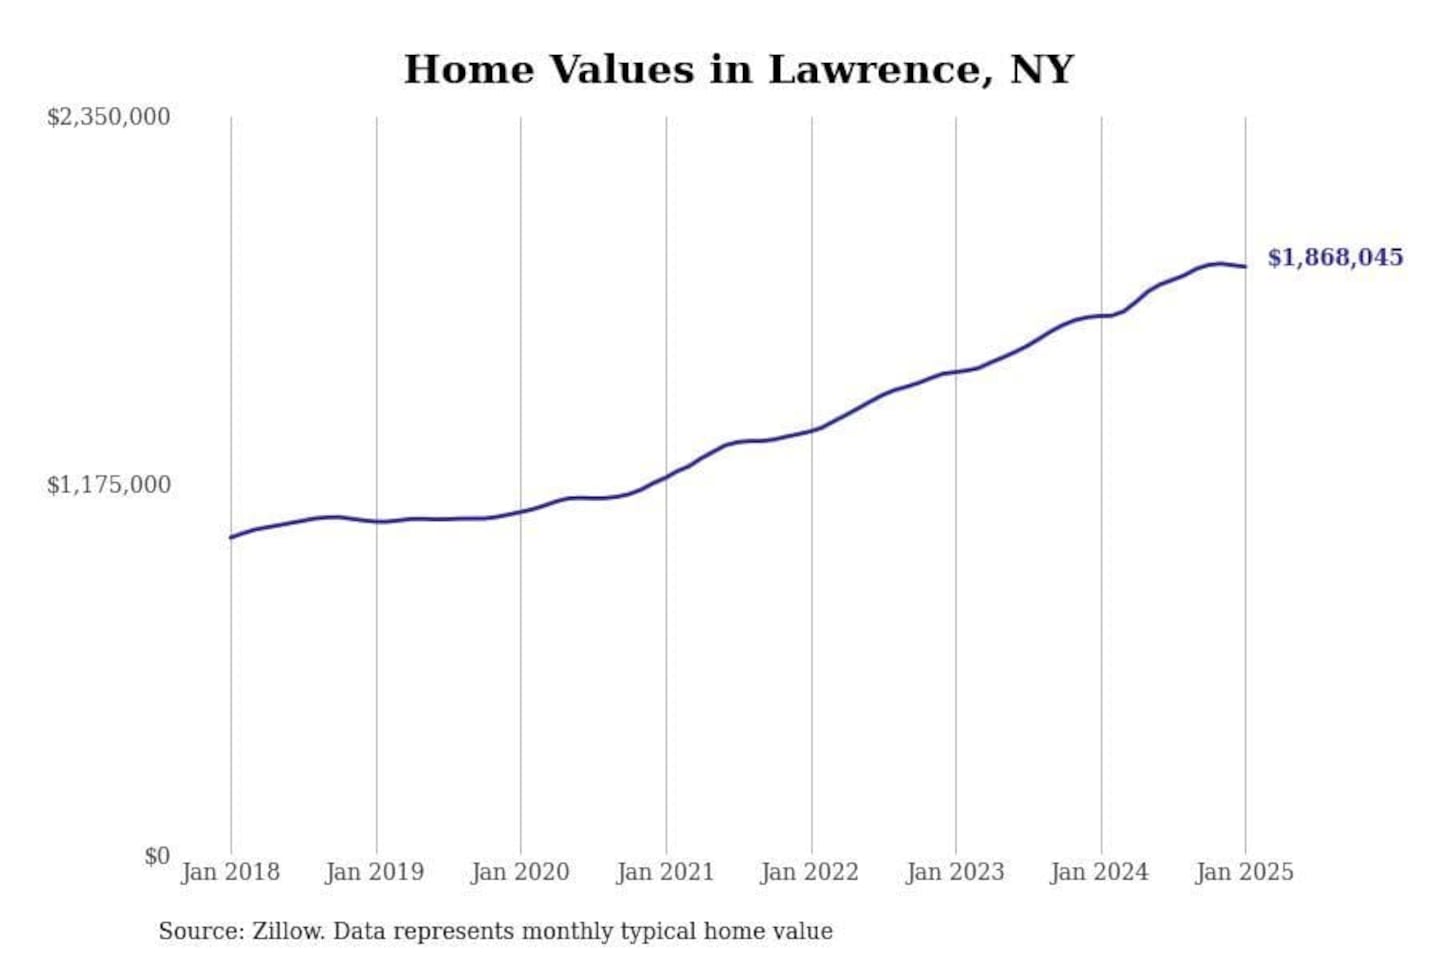
#20. Lawrence, NY
- 1-year price change: +$156,452 (+9.1%)
- 5-year price change: +$779,979 (+71.7%)
- Typical home value: $1,868,045 (#31 most expensive city in metro)

Stacker
#19. Saddle River, NJ
- 1-year price change: +$156,675 (+8.3%)
- 5-year price change: +$543,327 (+36.0%)
- Typical home value: $2,052,423 (#20 most expensive city in metro)
Stacker
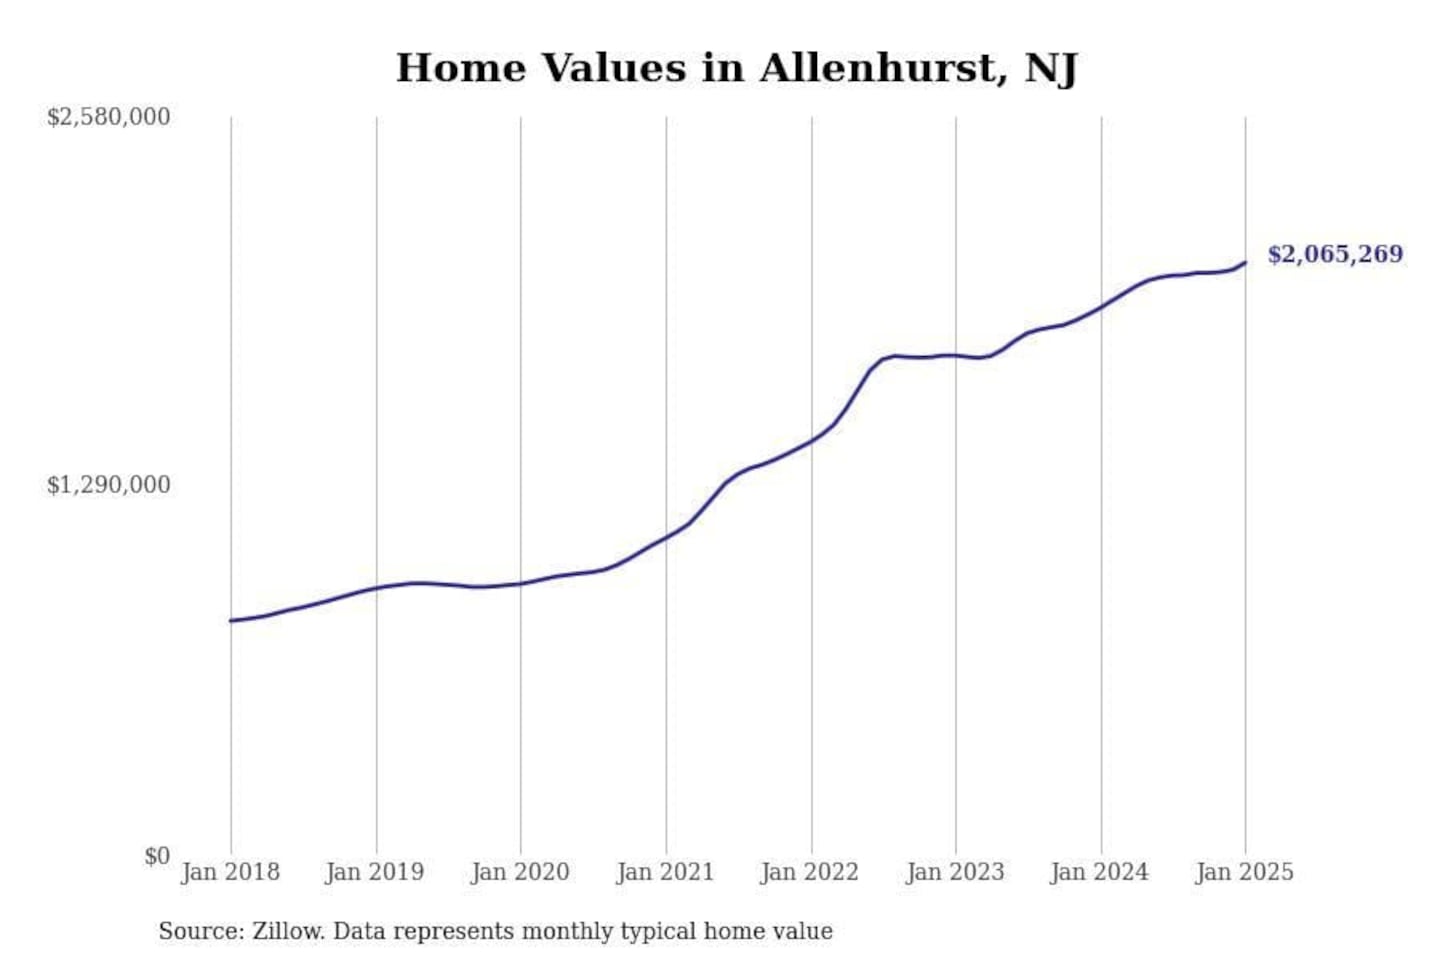
#18. Allenhurst, NJ
- 1-year price change: +$158,764 (+8.3%)
- 5-year price change: +$1,121,738 (+118.9%)
- Typical home value: $2,065,269 (#19 most expensive city in metro)
Stacker
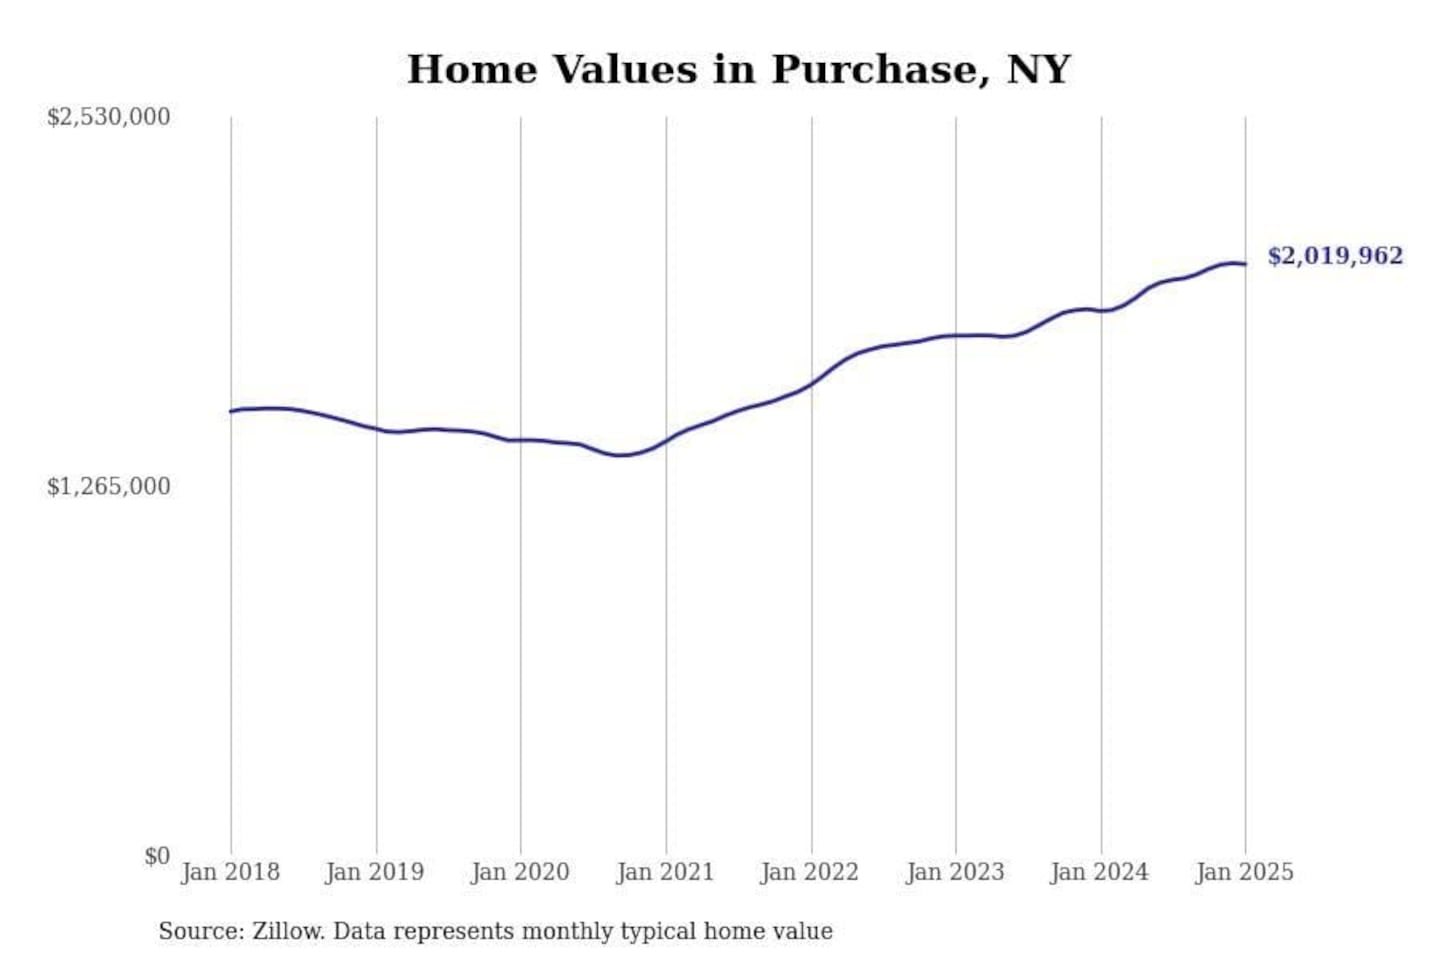
#17. Purchase, NY
- 1-year price change: +$160,153 (+8.6%)
- 5-year price change: +$602,330 (+42.5%)
- Typical home value: $2,019,962 (#24 most expensive city in metro)
Stacker
#16. Alpine, NJ
- 1-year price change: +$164,524 (+6.5%)
- 5-year price change: +$751,512 (+38.3%)
- Typical home value: $2,713,493 (#10 most expensive city in metro)
You may also like: New York City 7-day weather forecast
Stacker
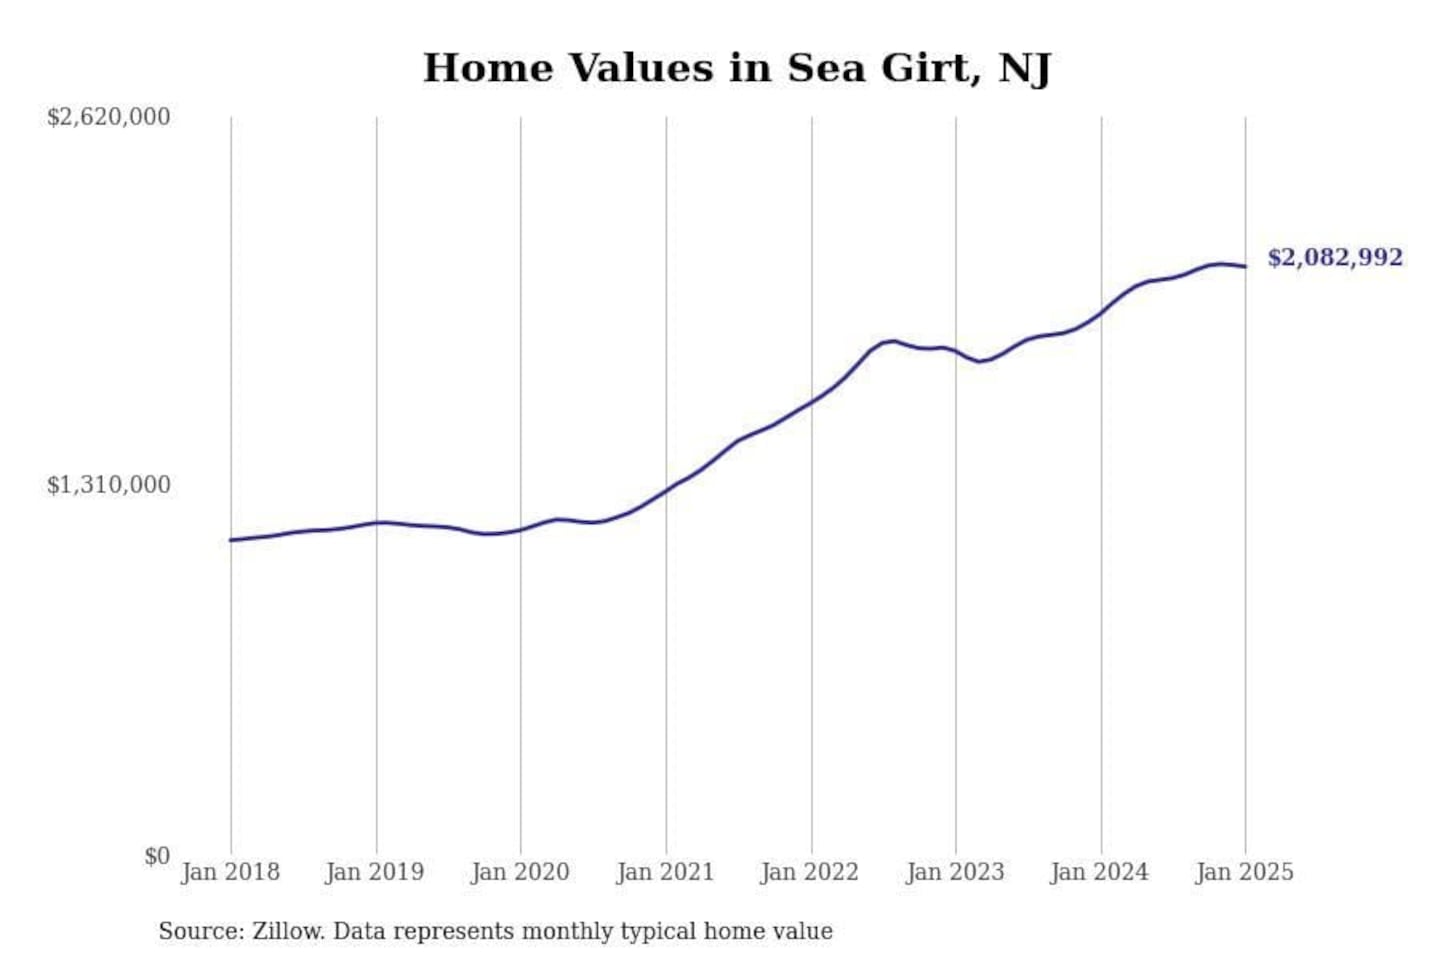
#15. Sea Girt, NJ
- 1-year price change: +$168,007 (+8.8%)
- 5-year price change: +$934,097 (+81.3%)
- Typical home value: $2,082,992 (#17 most expensive city in metro)
Stacker
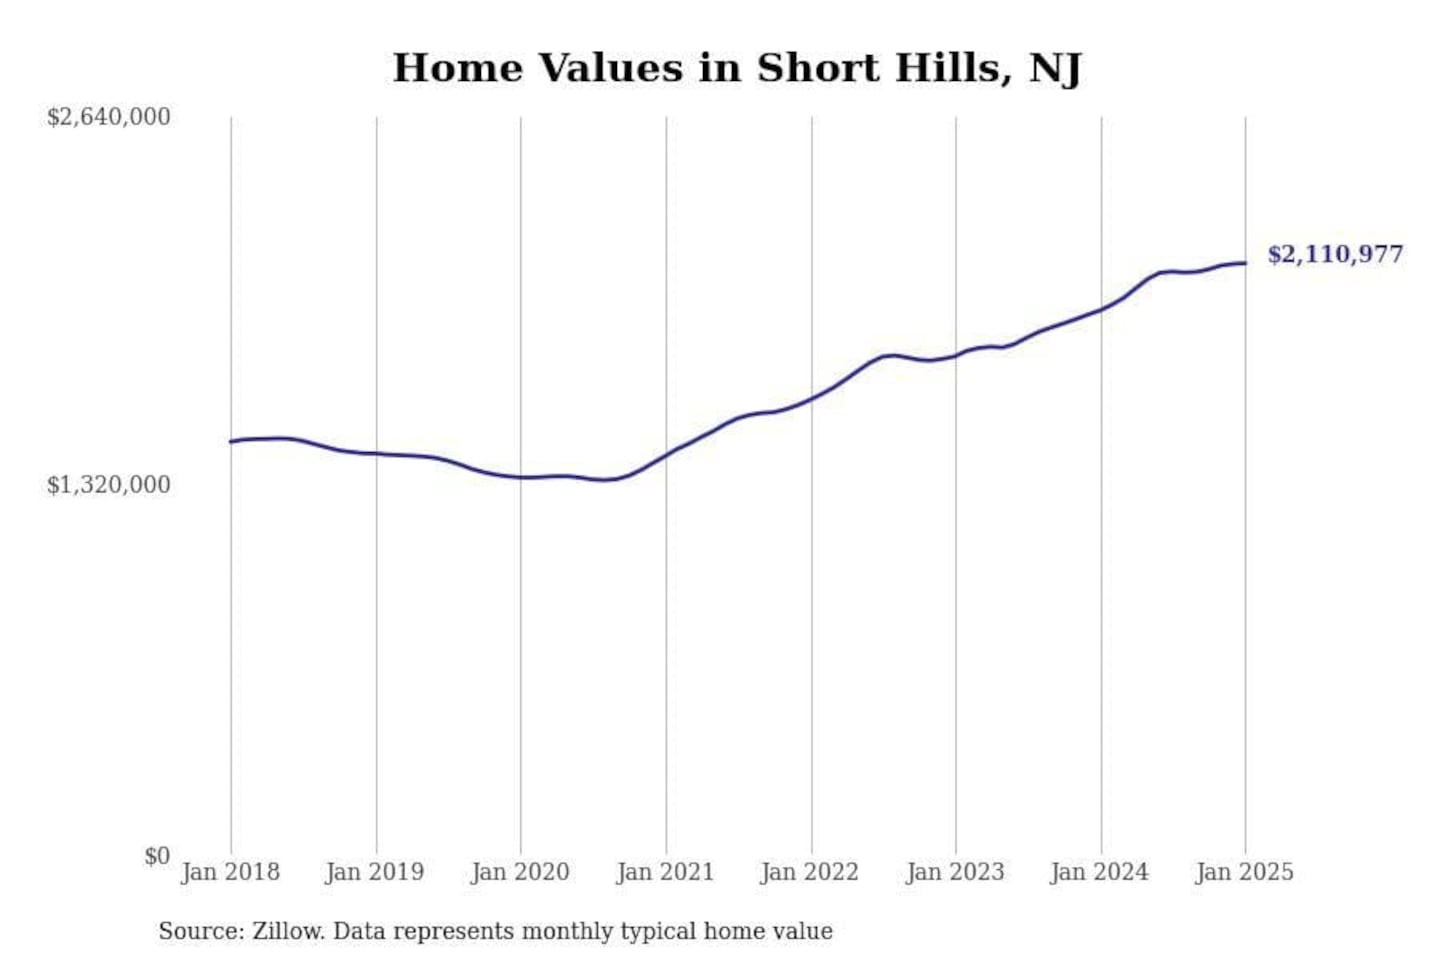
#14. Short Hills, NJ
- 1-year price change: +$168,238 (+8.7%)
- 5-year price change: +$764,946 (+56.8%)
- Typical home value: $2,110,977 (#13 most expensive city in metro)

Stacker
#13. Shelter Island, NY
- 1-year price change: +$169,465 (+11.7%)
- 5-year price change: +$764,946 (data not available)
- Typical home value: $1,621,799 (#37 most expensive city in metro)
Stacker
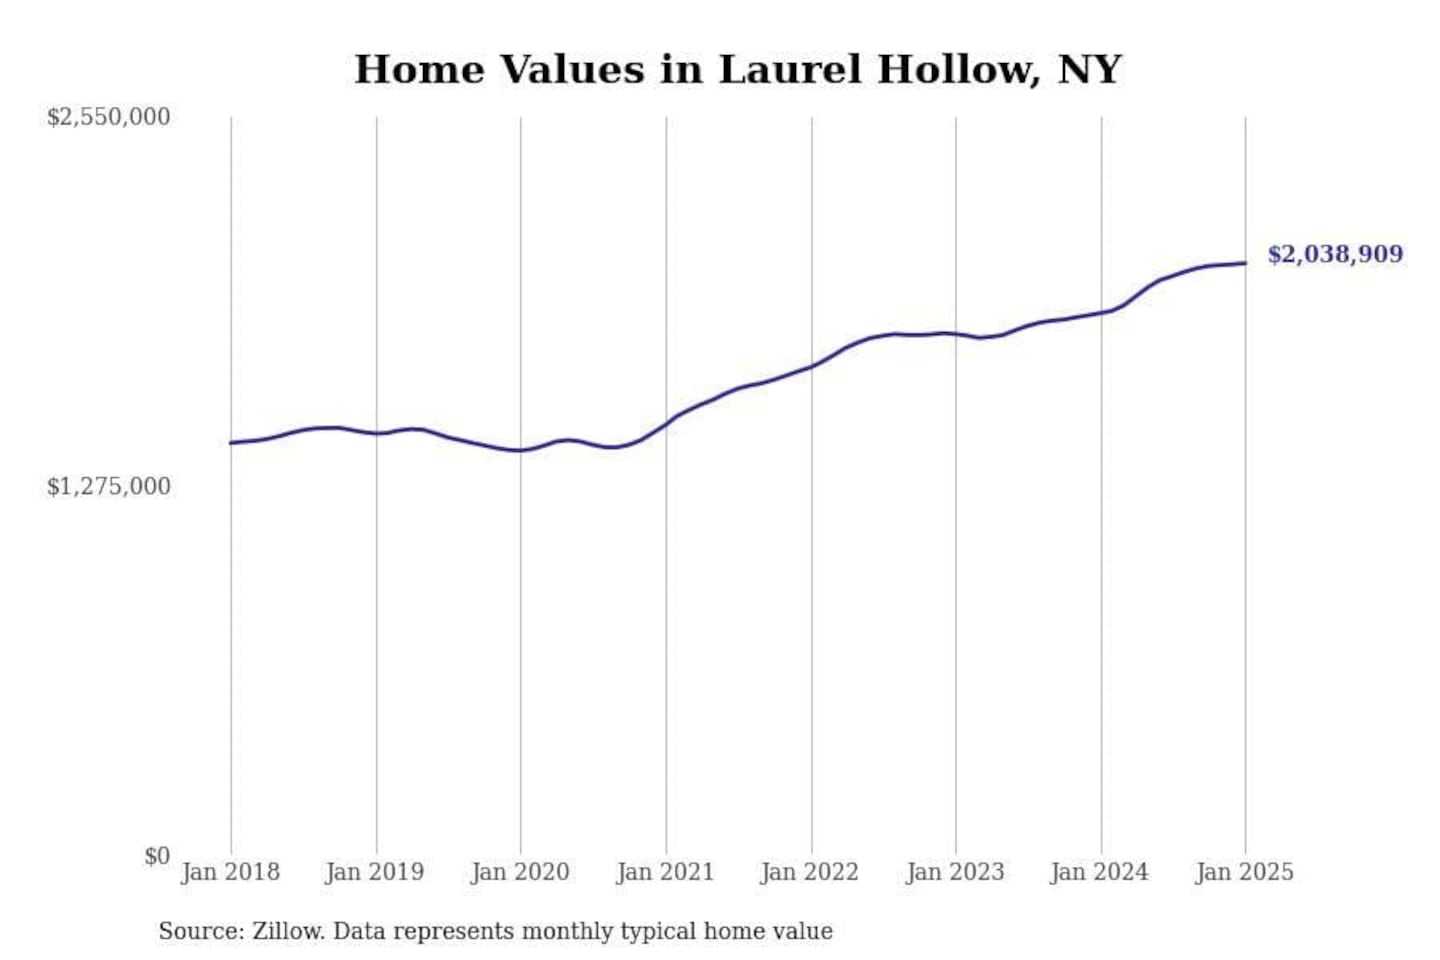
#12. Laurel Hollow, NY
- 1-year price change: +$171,950 (+9.2%)
- 5-year price change: +$646,051 (+46.4%)
- Typical home value: $2,038,909 (#21 most expensive city in metro)
Stacker
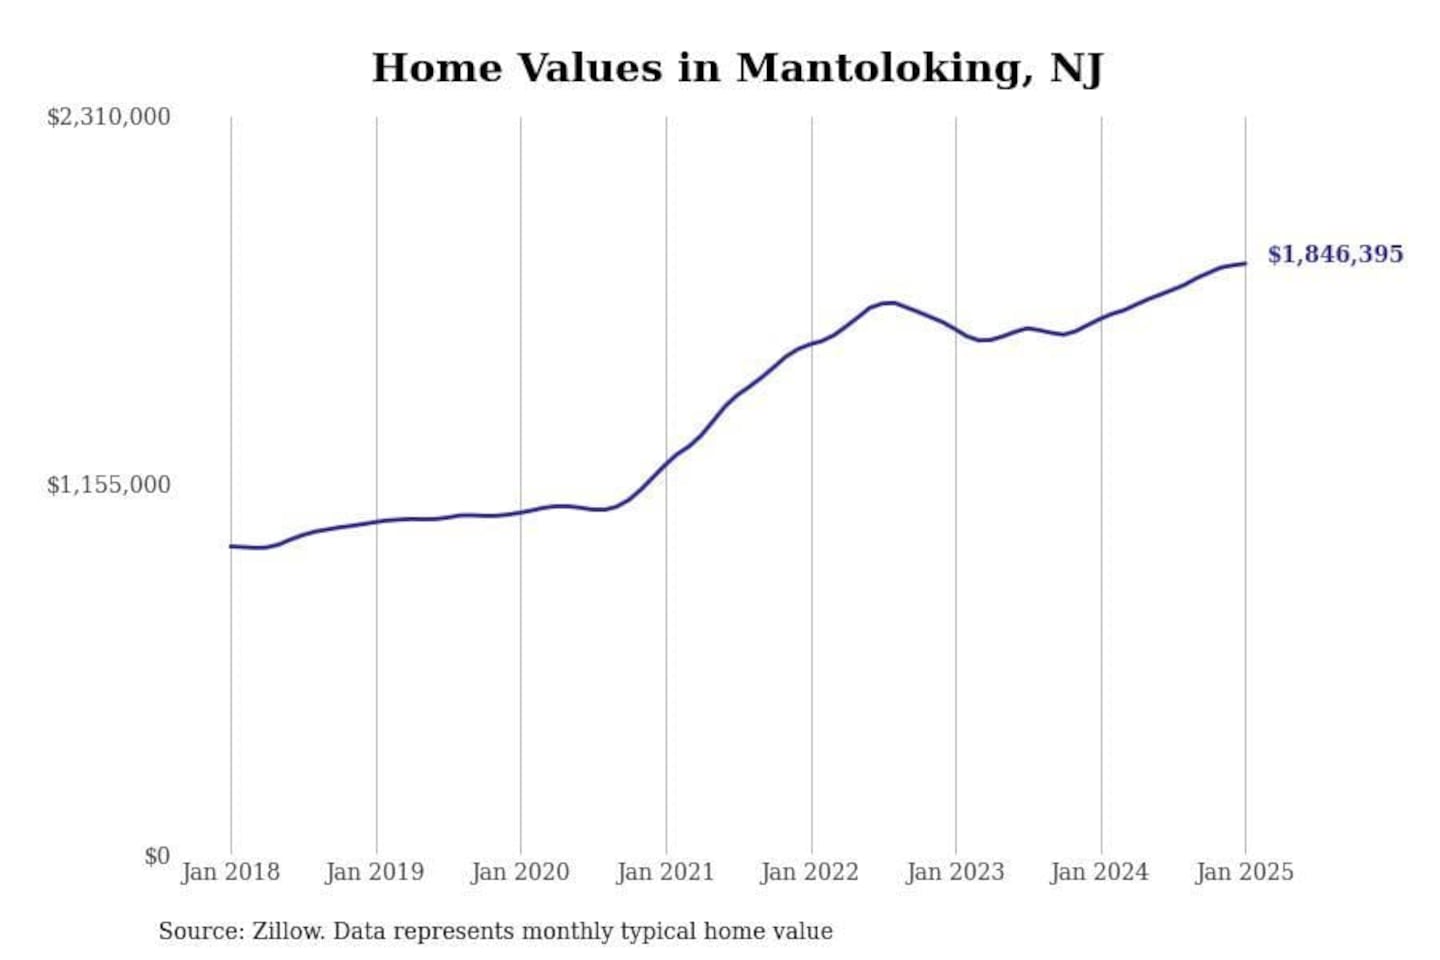
#11. Mantoloking, NJ
- 1-year price change: +$173,400 (+10.4%)
- 5-year price change: +$778,613 (+72.9%)
- Typical home value: $1,846,395 (#32 most expensive city in metro)
You may also like: How inflation of 10 items in New York City compares to the rest of the US
Stacker
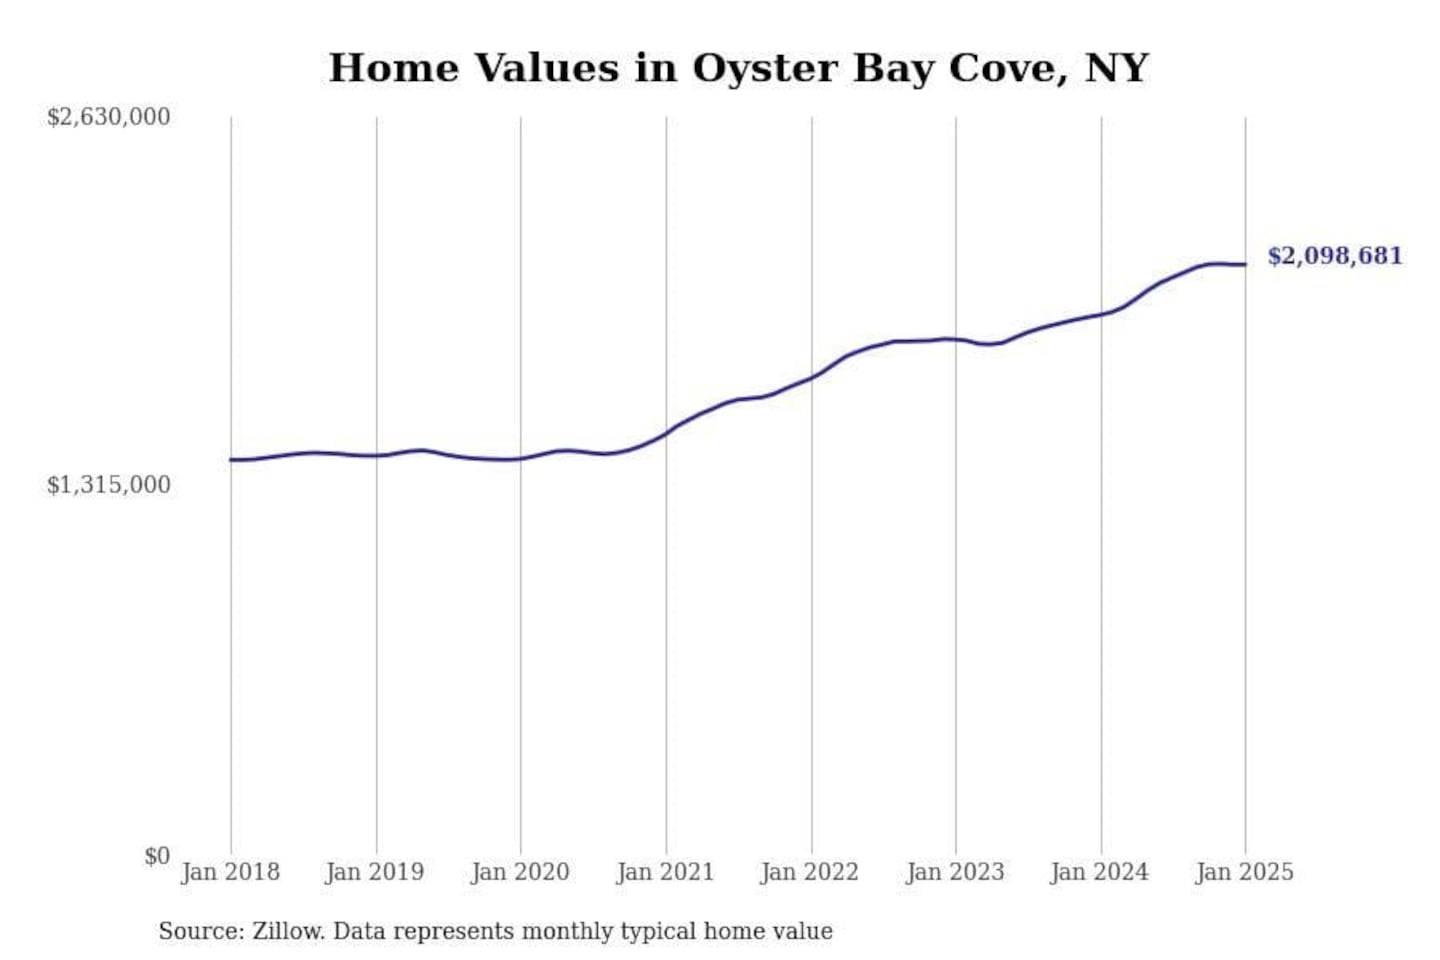
#10. Oyster Bay Cove, NY
- 1-year price change: +$179,642 (+9.4%)
- 5-year price change: +$692,113 (+49.2%)
- Typical home value: $2,098,681 (#15 most expensive city in metro)
Stacker
#9. Mill Neck, NY
- 1-year price change: +$180,405 (+9.5%)
- 5-year price change: +$649,513 (+45.7%)
- Typical home value: $2,070,093 (#18 most expensive city in metro)
Stacker
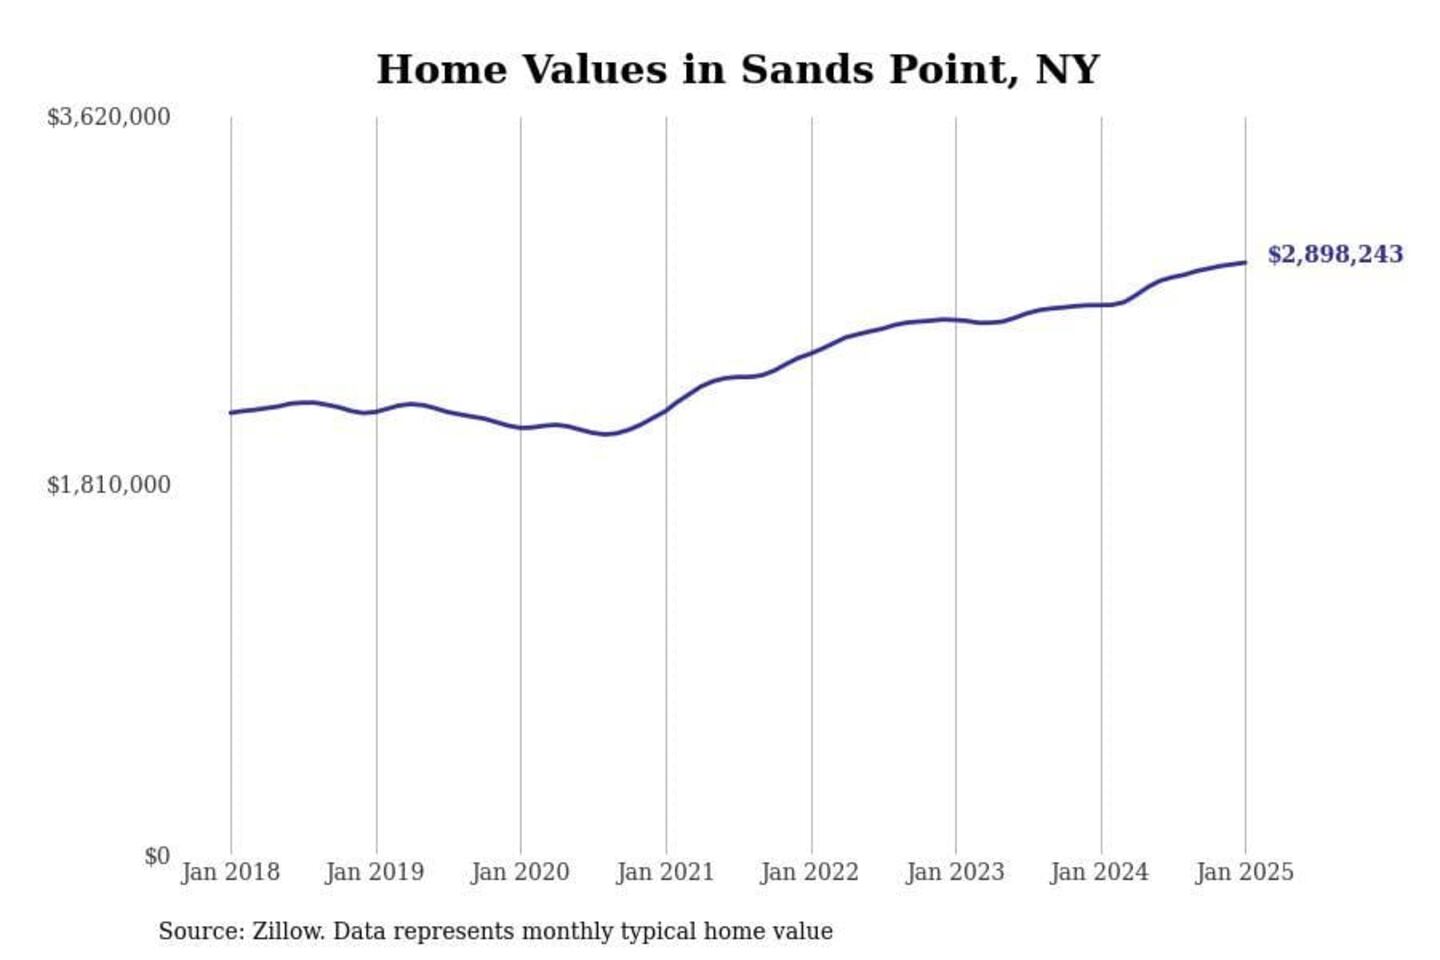
#8. Sands Point, NY
- 1-year price change: +$208,565 (+7.8%)
- 5-year price change: +$809,737 (+38.8%)
- Typical home value: $2,898,243 (#6 most expensive city in metro)
Stacker
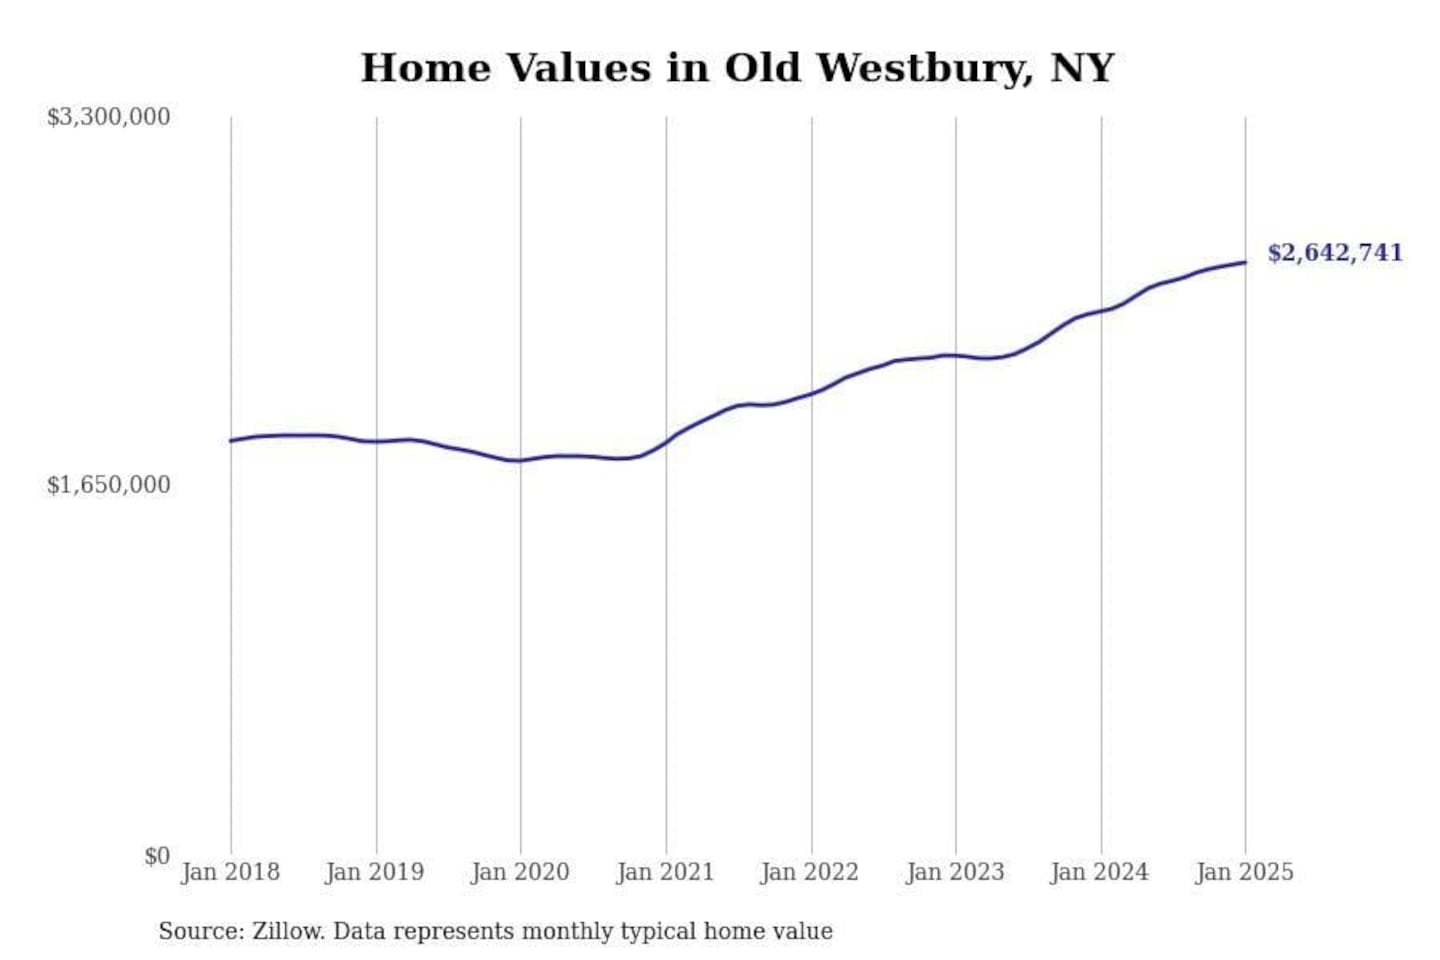
#7. Old Westbury, NY
- 1-year price change: +$219,234 (+9.0%)
- 5-year price change: +$885,611 (+50.4%)
- Typical home value: $2,642,741 (#11 most expensive city in metro)
Stacker
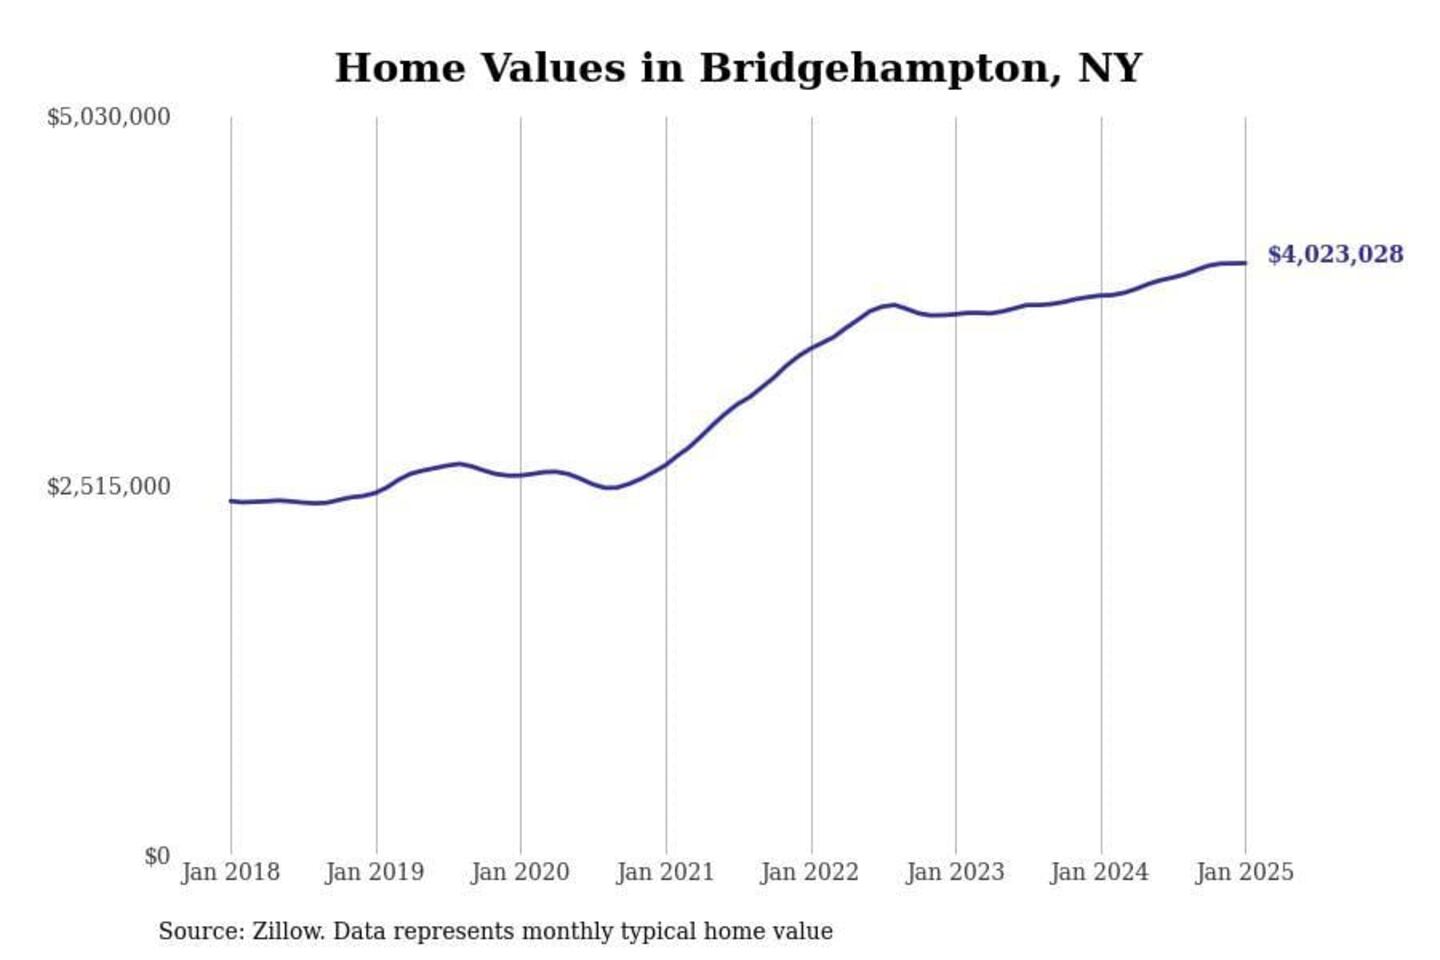
#6. Bridgehampton, NY
- 1-year price change: +$220,322 (+5.8%)
- 5-year price change: +$1,444,730 (+56.0%)
- Typical home value: $4,023,028 (#3 most expensive city in metro)
You may also like: Best suburbs in New York City
Stacker
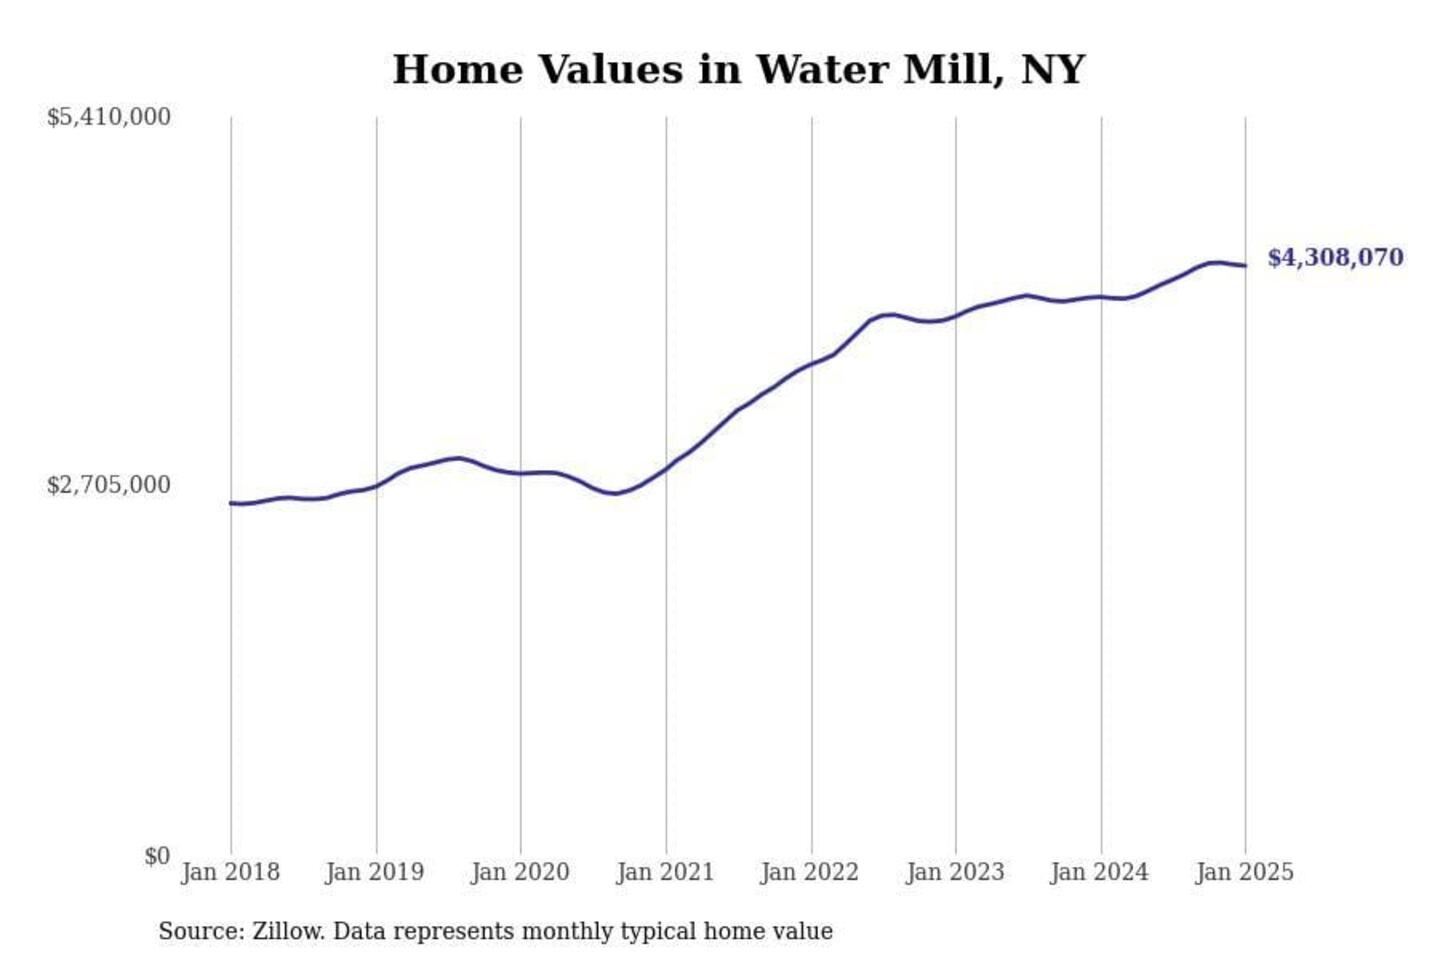
#5. Water Mill, NY
- 1-year price change: +$228,233 (+5.6%)
- 5-year price change: +$1,521,652 (+54.6%)
- Typical home value: $4,308,070 (#2 most expensive city in metro)
Stacker
#4. Upper Brookville, NY
- 1-year price change: +$244,784 (+11.8%)
- 5-year price change: +$746,251 (+47.5%)
- Typical home value: $2,318,864 (#12 most expensive city in metro)
Stacker
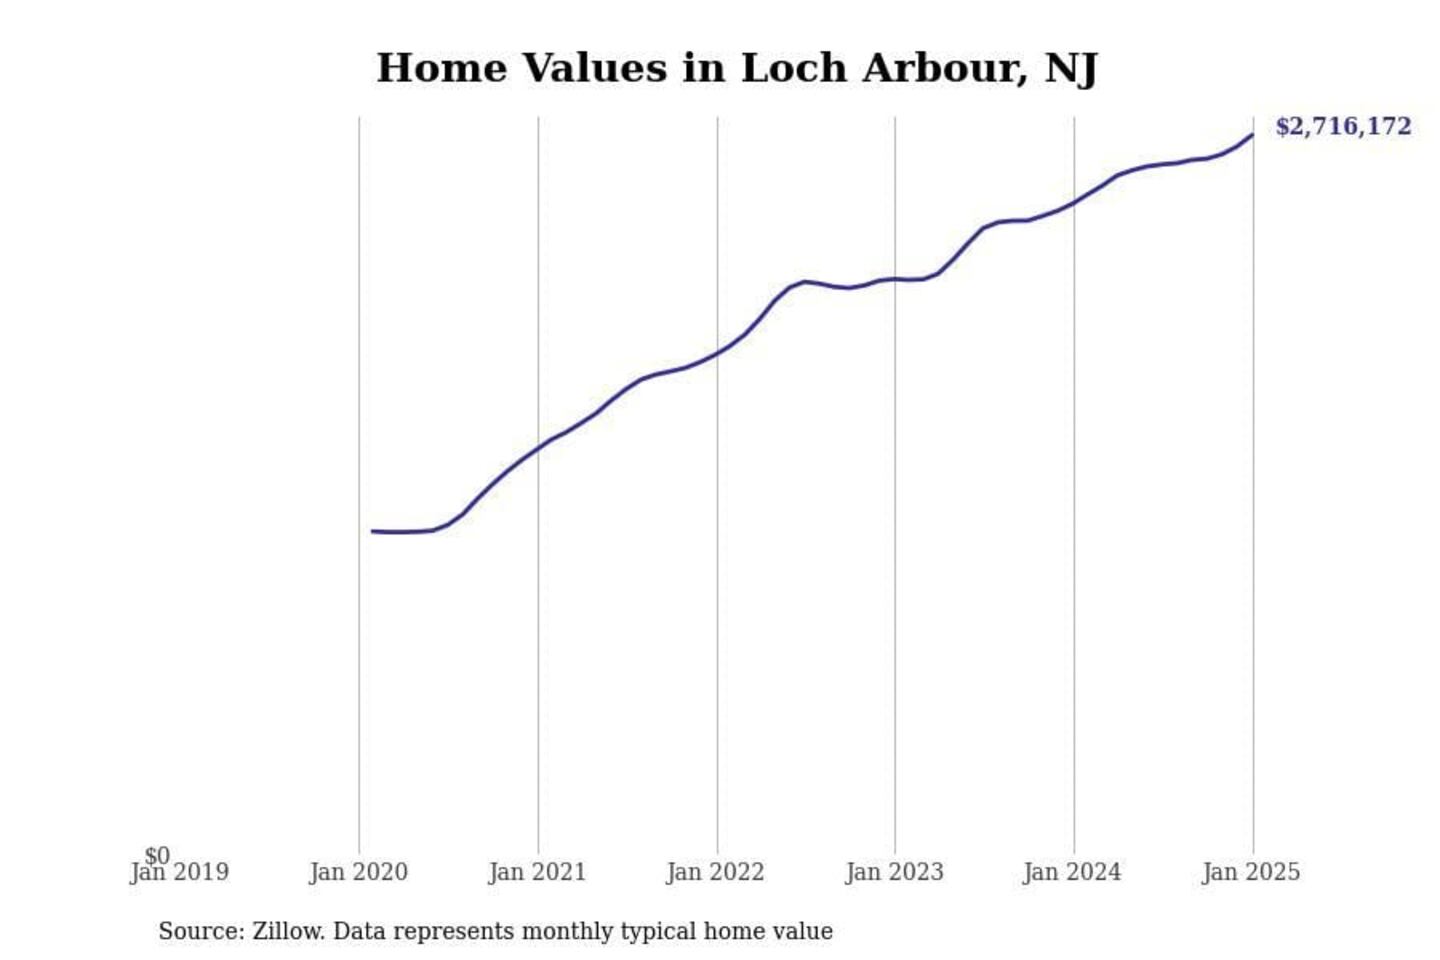
#3. Loch Arbour, NJ
- 1-year price change: +$258,480 (+10.5%)
- 5-year price change: +$746,251 (data not available)
- Typical home value: $2,716,172 (#8 most expensive city in metro)
Stacker
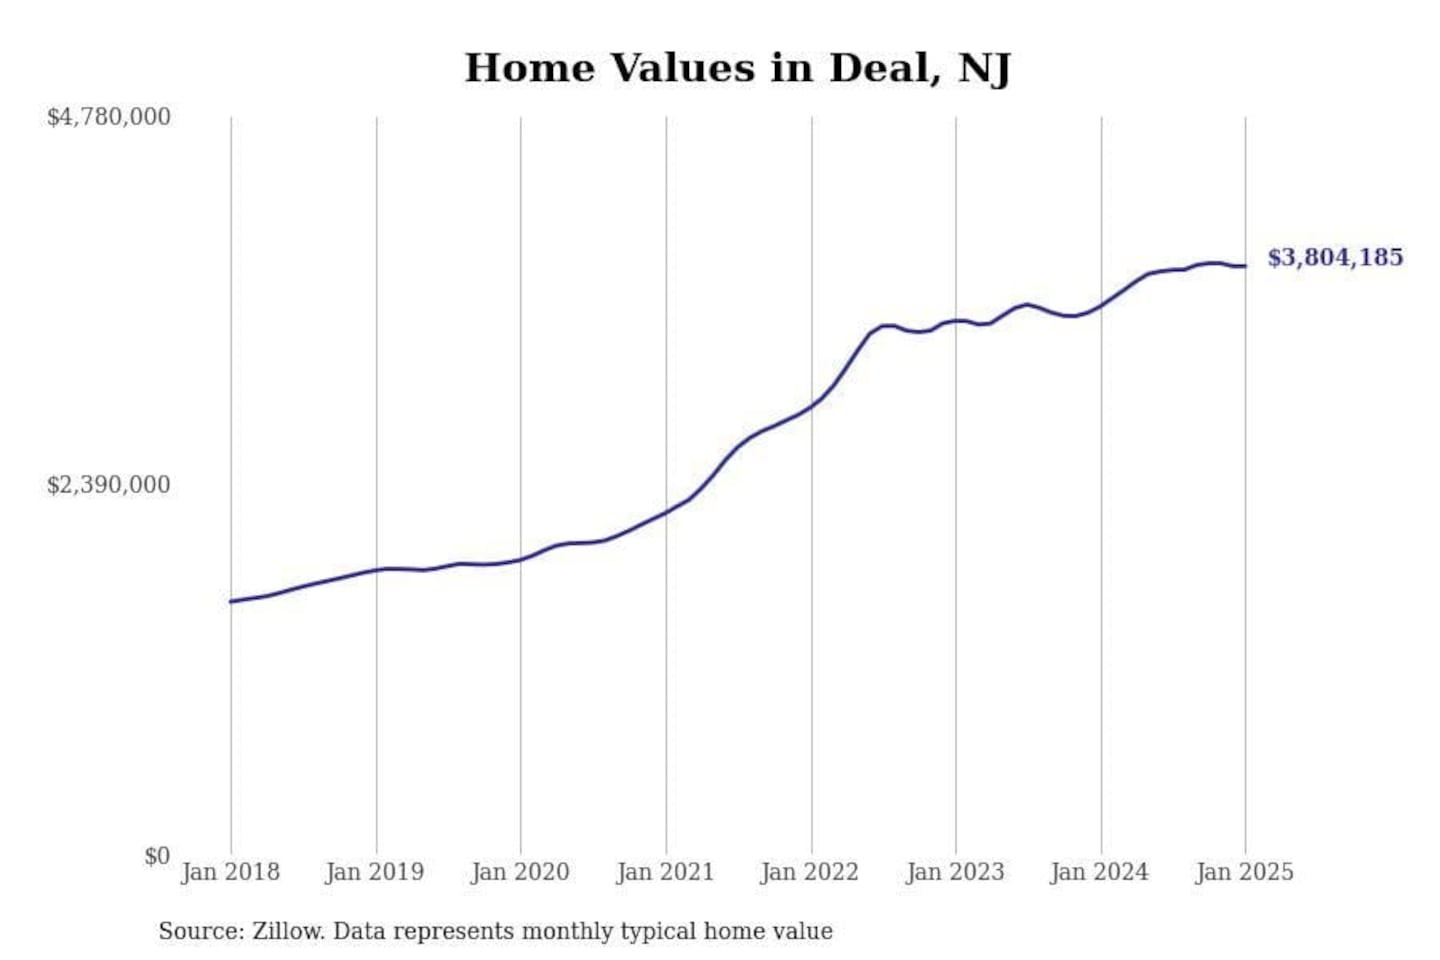
#2. Deal, NJ
- 1-year price change: +$262,004 (+7.4%)
- 5-year price change: +$1,900,661 (+99.8%)
- Typical home value: $3,804,185 (#4 most expensive city in metro)
Stacker
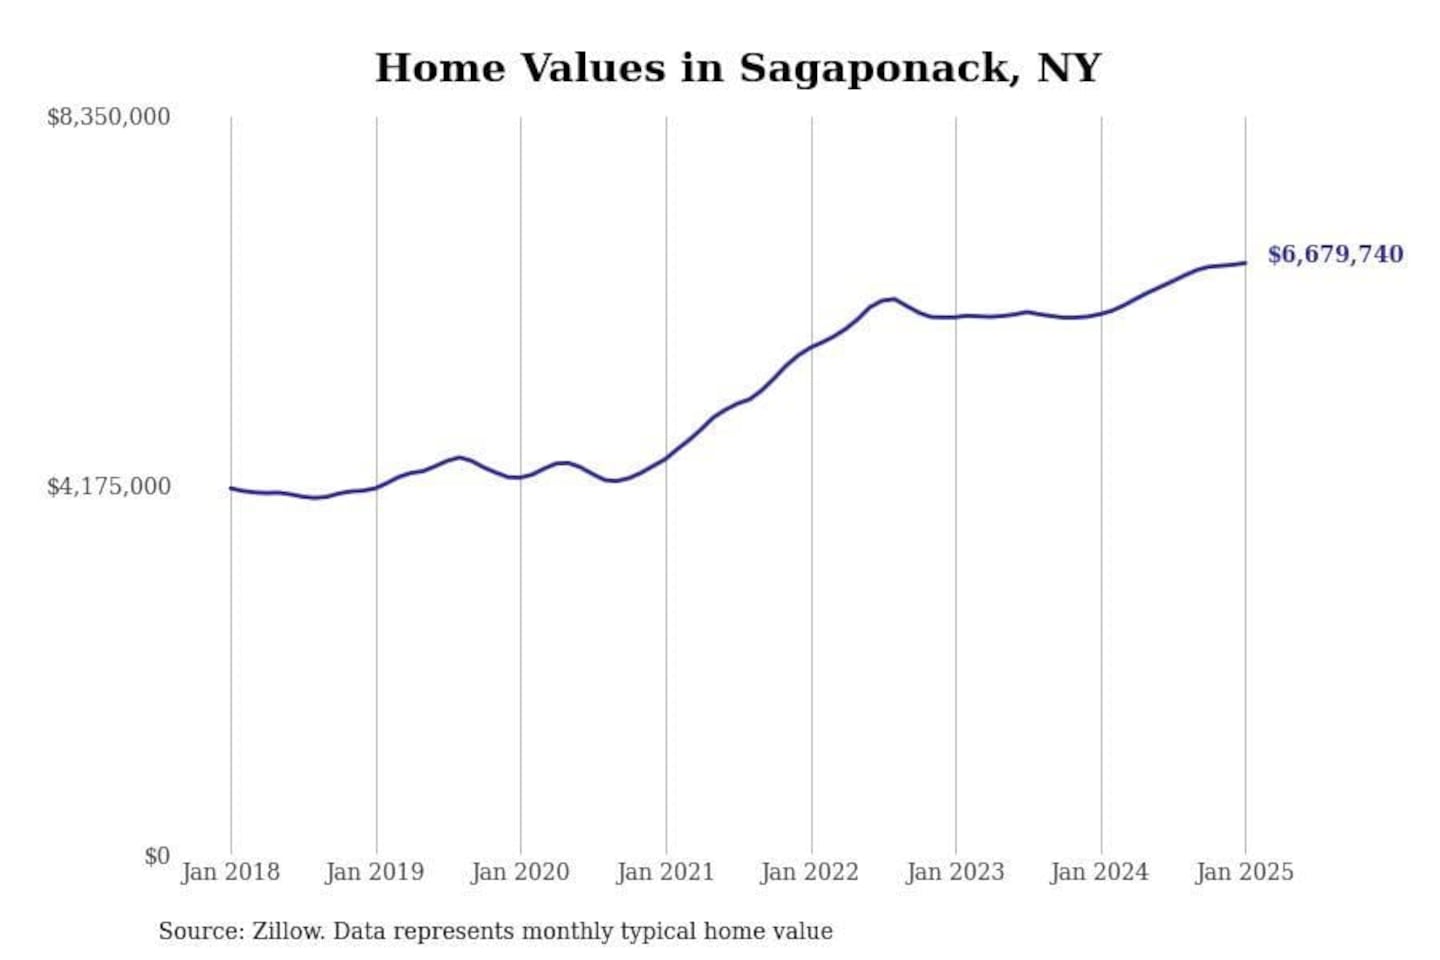
#1. Sagaponack, NY
- 1-year price change: +$577,427 (+9.5%)
- 5-year price change: +$2,423,803 (+57.0%)
- Typical home value: $6,679,740 (#1 most expensive city in metro)
You may also like: Best options in New York City for 6 popular outdoor activities
 Sign Up

